Plot clustered targets
Arguments
- cpo
a cpam object
- res
a tibble, output from
results()containing columns target_id, cp, and shape- changepoints
numerical or character; one or more changepoints (these should be the same as the ones used in
estimate_changepoint()- shapes
character; one or more shapes (these should be the same as the ones used in
select_shape()- alpha
numeric between 0 and 1; controls line transparency in plot (default: 0.1)
Details
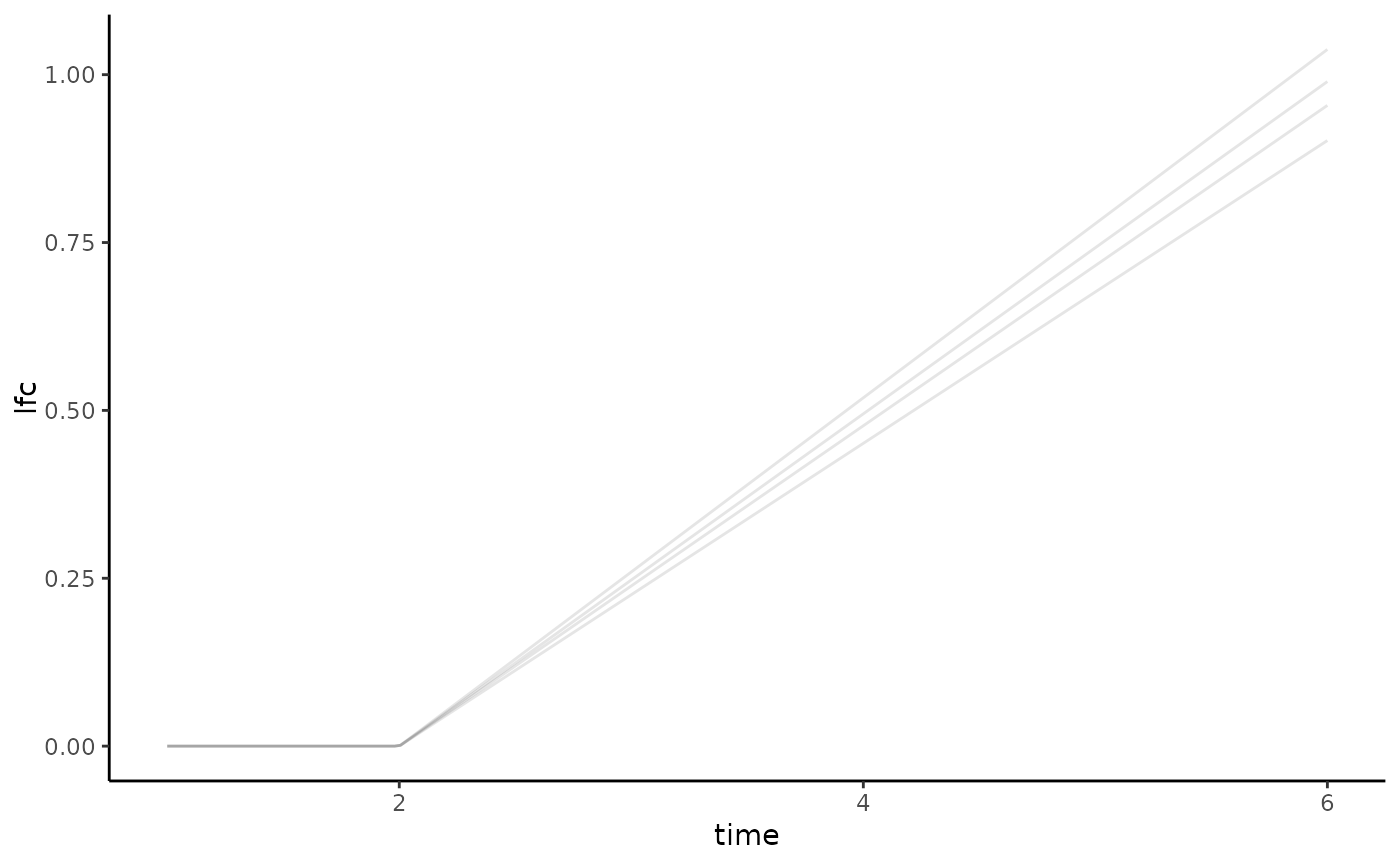
Plots the fitted trends for a set of targets whose estimated changepoints and
shapes are given by the arguments changepoints and shapes, respectively.
Creates a combined plot showing fitted expression trends for all targets that share specified changepoint times and shape patterns. Each line represents one target's fitted trajectory, with transparency controlled by alpha.
Examples
library(cpam)

# load gene-only example cpam object
load(system.file("extdata", "cpo_example.rda", package = "cpam"))

# Generate results table
res_example <- results(cpo_example)

# plot all targets with changepoint at timepoint 0 and shape "ilin" (increasing linear)
plot_cluster(cpo_example, res_example, changepoints = 2, shapes = "ilin")
#> Plotting 4 targets